Some implications behind SNP statistics
- Ghost
- Nov 25, 2017
- 2 min read
Note that the statistics we are going to talk about only applies to germline mutation, not somatic mutation.
Once we called a list of SNPs. it is routine that we get some statistics out of them. These statistics commonly include:
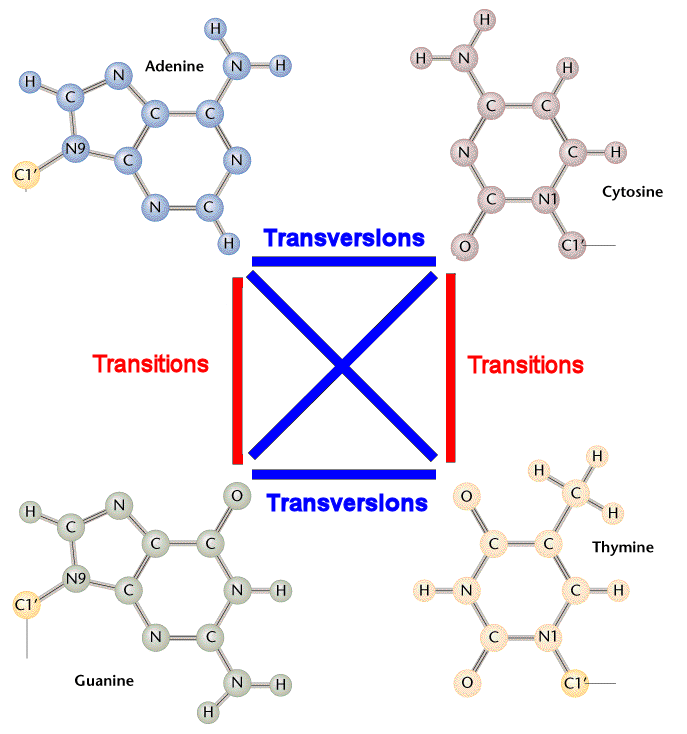
Transition / Transversion (Ti / Tv) ratio

As figure above, Ti / Tv ratio should be around 0.5 by pure chance. However, this ratio turns out to be much higher in reality because of: 1) Tautomeric shifts. 2) Transition tends to be silent mutation which is more tolerable biologically.
In reality, Ti / Ts ratio varies across different chromosome region:
Genome wide: 2.0-2.1
Exome: 2.6-2.8
Coding region: 3.0-3.2
Mitochondria: much higher
The ratio is high within exome and coding region than genome wide because: 1) Exome is under stronger selective pressure against missense mutations, whereas many transitions are tolerated as silent mutations. 2) Higher rate of CpG island in which C is easily go through tautomeric shifts.
The estimation of Ti / Ts ratio above is based on SNP calling from normal human cell. This ratio varies dramatically across species as well as across phenotype.
How would the statistics be helpful? Well, if you are calling SNP from normal human cell, you would expect you got Ti / Ts ratio within the range described above. Large deviation could imply that you sample may have contamination.
Non-synonymous / Synonymous (Ka / Ks) ratio Ka / Ks ratio is an indicator of selective pressure. Ka / Ks ratio > 1 implies positive selection ( stabilizing) and Ka / Ks ratio < 1 implies negative ( purifying ) selection.
However, Ka /Ks as indicator of selective pressure limits itself within protein coding region. Evolutionary change can take place in regulatory region, even epigenetic level, affecting the gene expression. Besides, there are other complications such as balancing selection and relaxed selection that are not easily derived just by calculating Ka /Ks. In short, Ka / Ks can only give you a glimpse of selective direction, far from conclusive.
Singletons
When you have multiple samples, SNP only existing in single sample is singleton. There is no "standard" number of singleton or a way to calculate the "standard" amount of singleton across samples. I imagine that the number of singleton decreases as the number of sample increases.
Besides, singletons are laying on the external branches of the sample genealogy, i.e. external mutations. such variants have better change to be deleterious mutations. In contrast, non-singletons are found in the internal branches (internal mutations) and they are more likely to be neutral. This is the same logic as mentioned in Variant frequency, effect size and GWAS limitation.
Let's pay attention to these two scenario:
When calling SNP from fair amount of samples, you are more likely to identify rare mutations (singletons). However, these singletons also have better change to be sequencing errors. To identify rare mutations with high confidence, relatively high depth of coverage is required.
When significant amount of singleton belong to specific samples, it is a sign that these samples might be poorly handled experimentally or bioinformatically.


Comments